Multivariate Analysis Web App
 multivariate
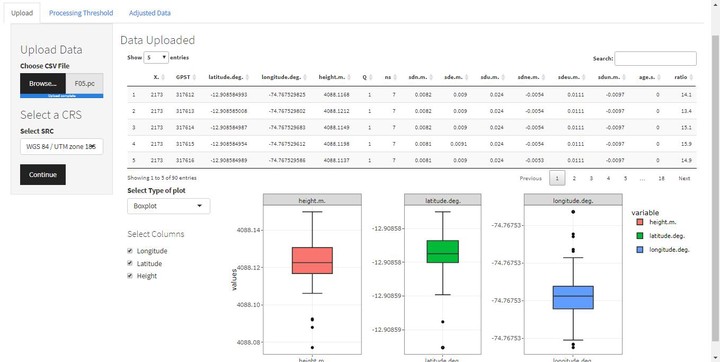
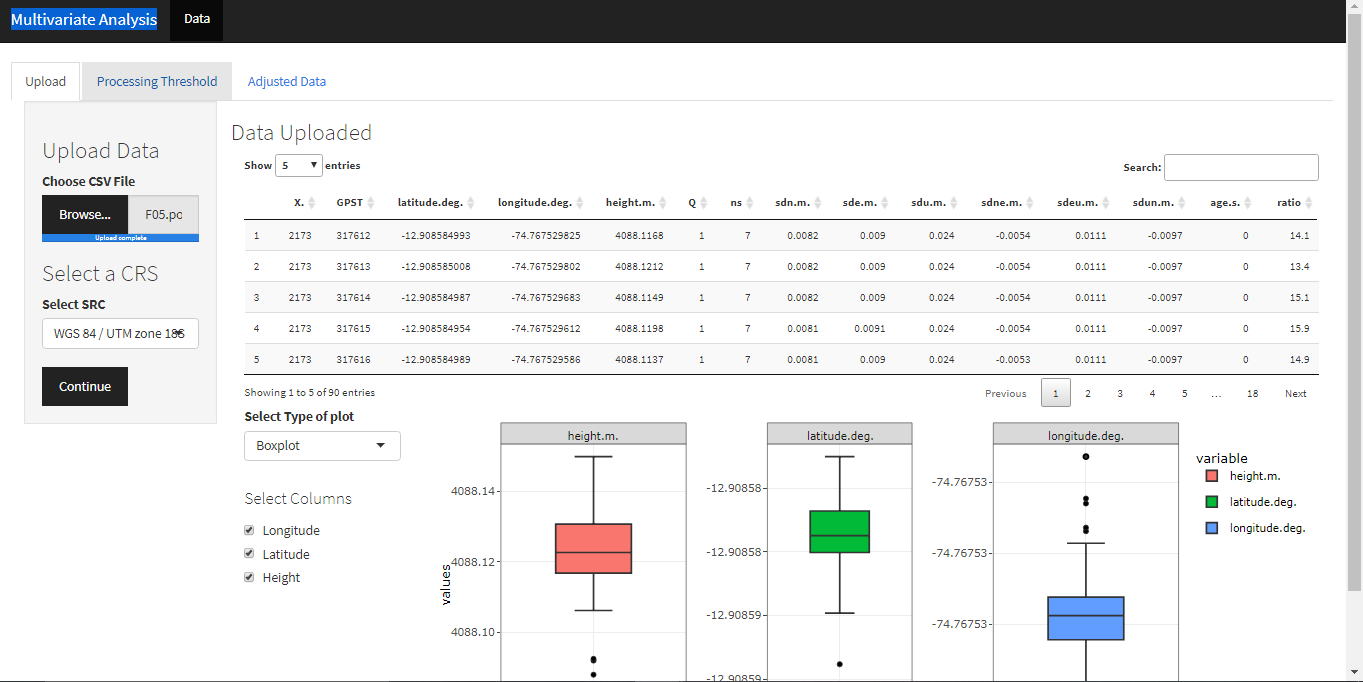
A basic web app to test a multivariate analysis with the files result of a post-processing analysis with satellite images. The application accept a (.pos) file to run the process.
Control Panel
The app shows a basic statistical description with the main values as box plots and histograms. In the processing threshold panel, we run a Mahalanobis algorithm to identify outliers in the data.
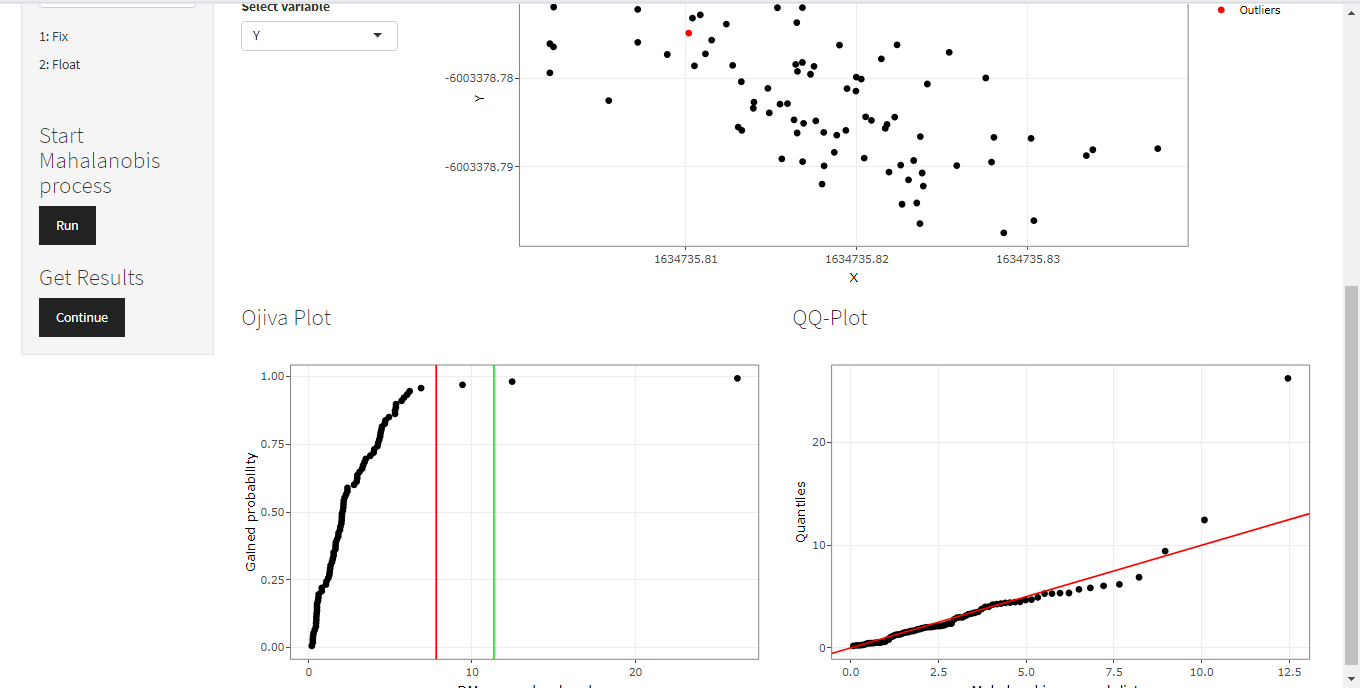
Outliers
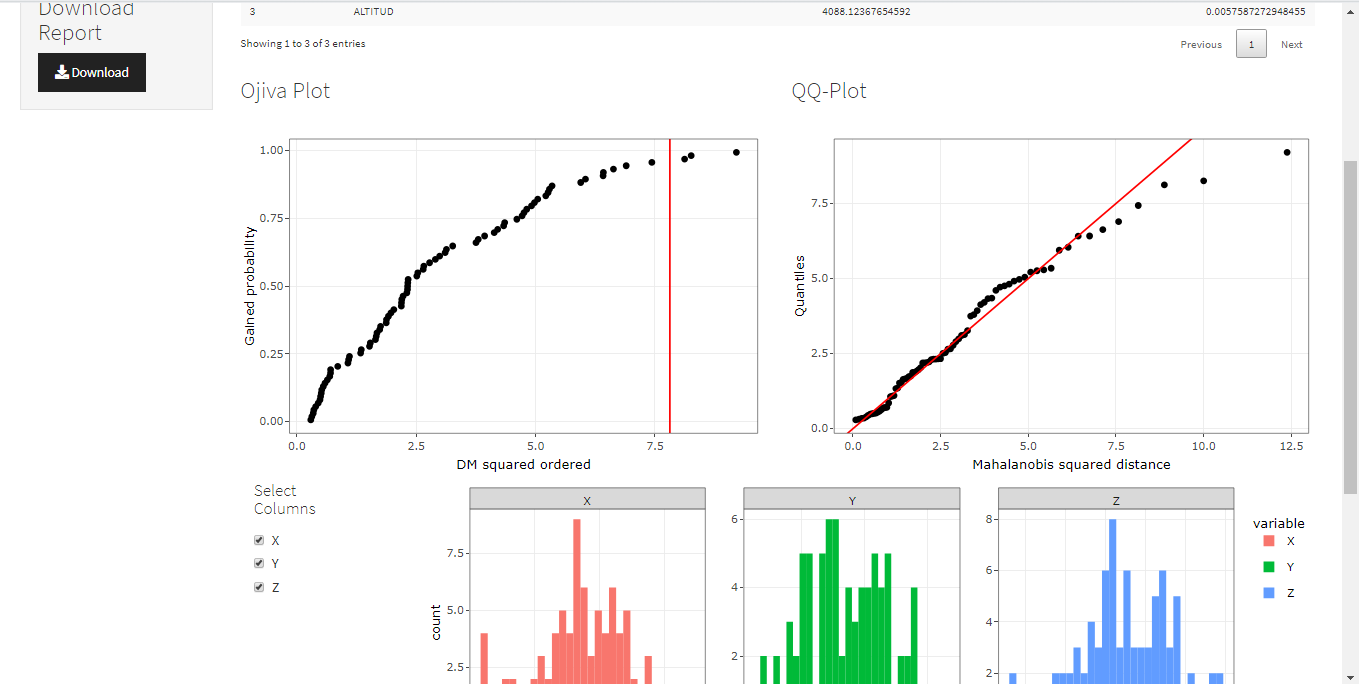
Finally, in the adjusted data panel we get the results of statistics-adjusted data and their respective plots of the final output. The app allows downloading the output data in a (.csv) file.
Results
Héctor Báez
Geologist Engineer
My research focuses on spatial data analysis, GIS, and web development to share knowledge of geospatial data.